COMSOL numerical simulation of Differential Acoustic Resonance Spectroscopy
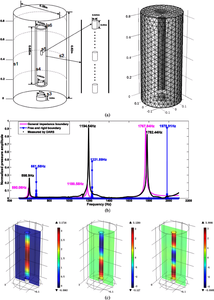
Differential Acoustic Resonance Spectroscopy (DARS) was developed to examine changes in the resonant frequencies of a cavity perturbed by the introduction of a centimetre-sized sample. This laboratory-based measurement technique fills an experimental gap between the low-frequency stress-strain method (quasi-static to several kHz) and the ultrasonic transmission technique (hundreds of kHz to GHz). By COMSOL,we assessed whether the amended DARS perturbation equation, obtained through a Green’s function-based theoretical derivation and under a general impedance boundary condition, was able to reflect the operation mechanism of the DARS system with greater precision and accuracy than past approaches. We designed a three-dimensional model, whose dimensions and geometry were kept consistent with the physical attributes, to implement the finite element simulation. In our DARS model, the speed of sound and the density of the cavity fluid were 970 m/s and 930 kg/m3, respectively, the same as the properties of the fluid (silicon oil) used in the DARS measurements. The finite element analysis was implemented relative to the empty DARS resonance cavity (without samples loaded) in two steps. First, we set the boundary conditions as two simple cases, free boundary for the boundary S6, and perfectly rigid boundary both for the left and right sides of the aluminium resonance cavity and for the left, right, and bottom sides of the silicon oil tank of Lucite material. Second, all boundaries at S1, S2, S3, S4, S5, and S6, were set using general impedance conditions according to the individual impedance values of their corresponding contact materials. This use of general impedance boundary conditions allowed for energy exchange during the acoustic propagation between the inside and outside boundaries and, thus, conformed to the physical truth. For both boundary condition settings, the DARS simulations were conducted to explore resonance occurrence by applying a sinusoidal excitation to the DARS resonance cavity, monitoring the acoustic pressure at a point inside the cavity, and repeating the process for many frequencies ranging from 500 Hz to 2000 Hz. Fig(b) shows the simulated resonance curves for the two cases. The results indicate that the simulated resonance frequencies, under the settings of general boundary conditions, are much closer to the measured results at all three resonance modes, as compared with the simulated resonance frequencies under the settings of free and perfectly rigid boundary conditions. Finally, through the DARS simulations we were able to obtain pressure distributions corresponding to the fundamental, second, and third resonance modes, as shown in Fig (c). The results show that the pressure distributions in the empty DARS resonance cavity, under the two aforementioned boundary condition settings, exhibit the same patterns but with variations in the acoustic pressure amplitude. Demonstration by COMSOL's numerical simulation, the Differential Acoustic Resonance Spectroscopy laboratory device, in conjunction with the amended perturbation formula are useful tools for estimating the acoustic properties of centimetre-sized rock samples in the low frequency range.
Download
- 皓_poster.pdf - 2.74MB
- 皓_abstract.pdf - 0.03MB